
Net foreign currency purchase grew by 22 times in May
- Maksim Rajeuski, BDG
- 10.06.2014, 15:23
- 1,719
Comparing to previous years the May’s indicators set records.
Despite the expectations and hopes that tourists would bring foreign currency during the ice hockey world championship in Minsk, the situation turned out to be the opposite – in May this year’s record has been set in the amount of net foreign currency, purchased by physical persons.
Apart from that, the aggregate amount of net purchase ended up being the year’s top in all segment of the foreign currency market. Compared to April, it has grew by over 22 times from $13 million up to $292 million (fig. 1).
Fig. 1. Net purchase/sale of foreign currency in Belarus by month within market sectors
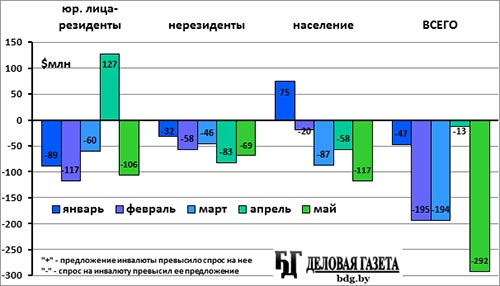
The share of the May’s negative balance in the business sector in the aggregated balance is 36.3%, the non-residents account for 23.5%, physical persons – 40.2%. So far the only two positive monthly balances remain the trades in the foreign currency market by physical persons in January and resident businesses in April.
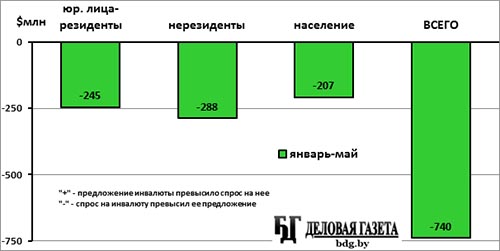
In five months of the year in all the foreign currency market segments there is net demand for foreign currency, notably of roughly the same share: the share of resident businesses is 33.1%, non-residents – 38.9%, physical persons – 28.0% (fig. 2).
Fig. 2. Net purchase/sale of foreign currency in Belarus in May within market sectors
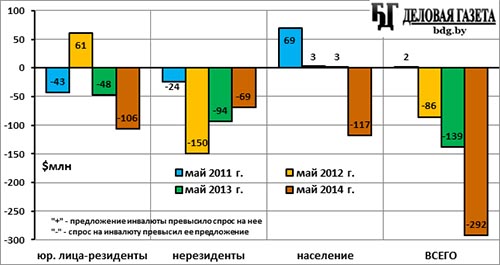
If we compare to the previous years, then the May of 2014 is the worst. However, at the same time it should be noted that in May 2011 the cash currency market went completely into the shadow, it was practically impossible to buy foreign currency in currency exchange offices and the registered foreign exchange operations only comprised a part of the currency market for physical persons. Only in the non-residents sector the May of the current year has shown positive dynamics (fig. 3).
Fig. 3. Net purchase/sale of foreign currency in Belarus in May of 2011-2014 within market sectors, $ mln.
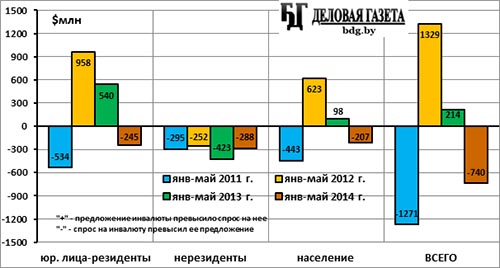
The foreign exchange market figures in January-May 2014 are also the worst in the post-crisis period: the net supply in the first five months of 2012 and 2013 has been replaced by the current year’s net demand of $740 million (fig. 4).
Fig. 4. Net purchase/sale of foreign currency in Belarus in January-May 2011-2014, $mln.
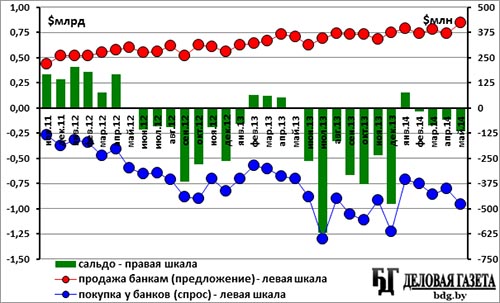
The deterioration of the situation in the foreign exchange market happened in May due to a sharp (by 19.9% as compared to April) increase in the aggregated demand (the amount of purchases in the all the segments of the market), while the aggregated supply (the amount of sales) grew since April by mere 9.5%. At the same time the monthly turnover in the foreign exchange market (as well as the demand and supply separately) in May is at its maximum this year. The net demand for foreign currency in the country has been in the market for 13 months in a row (fig. 5).
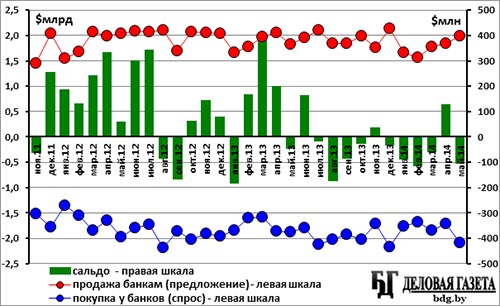
Fig. 5. Purchase/sale/balance volumes in foreign exchange market in Belarus by month
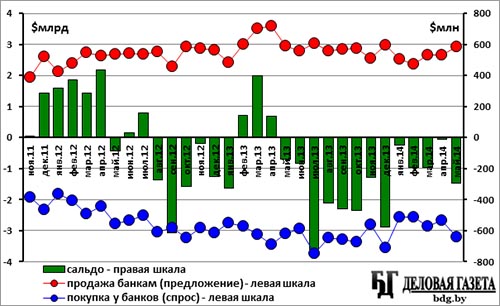
Note: Swap deal with China (6 billion yuans, ~$950 million) not included.
The amount of the aggregate (in all the segments of the foreign exchange market) net demand for foreign currency in May is 9.1% of the total demand. In April this figure was 0.5%, in March – 6.8%, in February – 7.5%, in January – 1.8%. In 2013: in December – 16.1%, in November 9.2%, in October – 14.0%, in September – 13.9%, in August - 13.1%, in July – 19.2%, in June – 2.8%. So the May figure is already close to the one of the second half of last year, the period of the mini crisis in foreign currency.
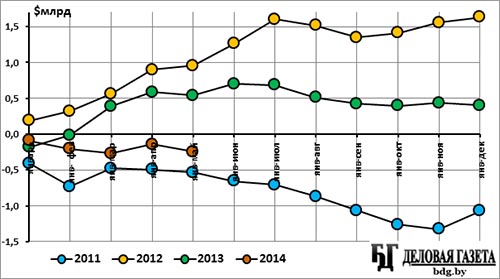
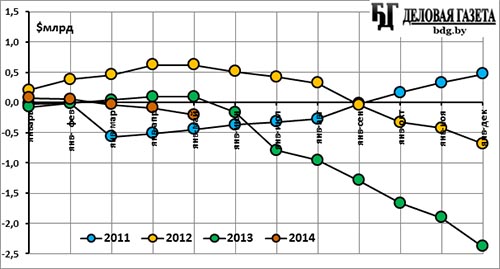
The dynamics in the five months of 2014 is worse than in the same period in 2013 and 2012, when the year started with an improvement in the foreign exchange market, but better than in 2011, when there was sharp deterioration from the very start of the year. If the deterioration tendency does not change, it is probable that the net foreign currency demand this year will be higher than last year, when the most part of the net demand accounted for the second half of the year, having brought its final figure up to $2.85 billion (fig. 6).
Fig. 6. Balance of purchase/sale of foreign currency in Belarus domestic market, progressive total
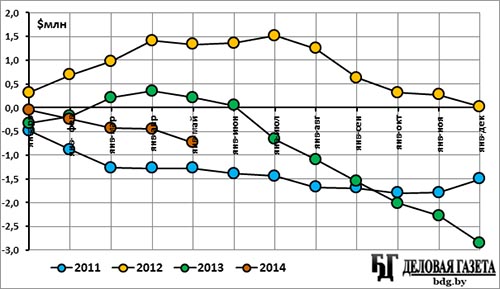
Note: Swap deal with China (6 billion yuans, ~$950 million) not included.
In the resident business sector, which accounts for about 2/3 of the total, the significant positive balance of the previous months has been replaced by quite a significant negative balance in May. At the same time the amount of the aggregate demand grew by 21.8% as compared to the previous month, while the supply only grew by 7.6%. Both reached maximum numbers this year (fig. 7).
Fig. 7. Volumes of purchase/sale of foreign currency by resident businesses in Belarus by month
The negative balance of the resident business sector accounted for 5.1% of the total demand in the sector. In April there was a positive balance of 7.4% of the demand, while in March, February and January the balance was negative and accounted accordingly to 3.3%, 7.0% and 5.1%. In 2013: in December – minus 1.6%, in November – plus 2.2%, in October – minus 1.5%, in September – minus 4.4%, in August – 8.6%, in July – minus 0.9% of demand.
Like in general over the foreign exchange market, the dynamics of the figures in this sector in the first five months of 2014 is significantly worse than in the same period in 2013 and 2012, but better than in 2011 (fig. 8).
Fig. 8. Balance of purchase/sale of foreign currency by resident businesses in Belarus, progressive total, 2011-2014
Non-residents are traditionally net-buyers of foreign currency. In May the turnover of the non-resident in the foreign exchange market grew as compared to April by 5.2%: the non-residents bought by $0.6 million less (minus 0.4%) than in the previous month, but sold %13.6 more (plus 16.4%). In the end the negative balance reduced by 17.2% from $82.8 million to $68.6 million.
Non-residents’ demand for foreign currency in their aggregate demand in May is 41.5%. In April it was 49.9%, in March – 34.4%, in February – 41.8%, in January – 30.4%. In 2013: in December – 40.9%, in November – 36.1%, in October – 27.7%, in September – 12.9%, in August – 27.0%, in July – 24.5%. The only month with a positive balance in several year remains February 2012 (fig. 9).
Fig. 9 Volumes of purchase/sale of foreign currency by non-residents in Belarus, by month
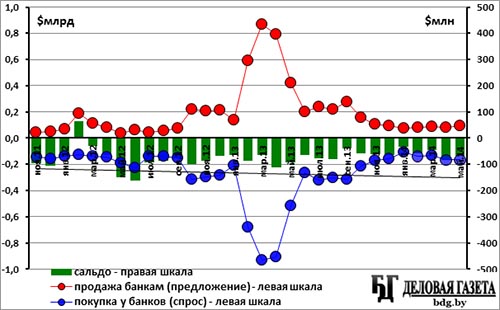
Note: Swap deal with China (6 billion yuans, ~$950 million) not included.
The balance dynamics in the non-resident segment of the foreign exchange market in the first five months of 2014 is better than in 2013 and 2011, but worse than in 2012. But judging from the yearly dynamics of the recent years, the end result practically does not change (fig. 10).
Fig. 10. Balance of purchase/sale of foreign currency by non-residents, progressive total
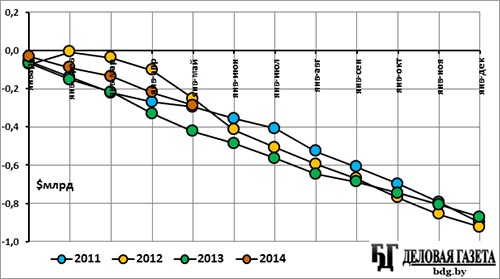
Note: Swap deal with China (6 billion yuans, ~$950 million) not included.
Private consumer imports and the aim to keep the savings from devaluation make physical persons in Belarus the largest net-buyer of foreign currency. The population keenly reacts to the change in the state’s financial affairs, which makes significant not only the fluctuations in the foreign exchange market in this sector, but the vector of its development may suddenly change its direction.
In May 2014 to these peculiarities added the inflow of hockey fans for the ice hockey world championship in Minsk, whose number accounted to several dozen thousand. By estimations, they were supposed to bring over half a hundred million dollars into the country.
Belarus National Bank’s statistics confirm the rapid increase in foreign currency supply in May – by 13.5% (as compared to April), mainly due to the growth of cash currency supply. In total numbers the growth in May accounted to $100.2 million, including %94.9 million in cash. In April there was the drop in the gross foreign currency supply. The total amount of the foreign currency sold by physical persons in May is $842.0 million, which is this year’s maximum (the previous maximum was reached in January - $787.6 million).
However, the demand for foreign currency on the part of physical persons grew in May even more sharply – by 20.0% or by $159.8, including $129.5 in cash. The amount of the foreign currency purchased by physical persons in May accounted to $959.4 million, which is comparable to the monthly purchase amounts in the second half of last year, in the period of the financial mini crisis, and is the record figure since the start of the year.
As a result the balance worsened in this foreign exchange market segment – the excess of demand over supply grew by over two times since April (by 103.6%), from $57.7 to $117.5 million. This is also the year’s maximum. (fig. 11).
Fig. 11 Volumes of purchase/sale of foreign currency (cash and non-cash) by physical persons
The net demand for foreign currency in the segment of physical persons accounted in May to 12.2% of the gross demand. In April this figure was 7.2%, in March – 10.1%, in February – 2.6%, in January there was net supply of 10.4% of the gross demand. In 2013 there was net demand: in December it accounted for 38.8% of the gross demand, in November – 25.8%, in October – 34.1%, in September – 31.4%, in August – 18.6%, in July – 47.6%, in June – 30.0%. In May for the first time this year the demand surpassed the supply in the cash market (by $6.7 million). From the start of the year the population has brought to banks $181.5 million more than took away.
The May figures in the foreign exchange market’s physical persons share somewhat spoilt the good start of the year. Similar figures were there in 2013, only last year the tendency was positive – the physical persons foreign exchange market resulted to net supply, while now the net demand is growing (fig. 12).
Fig. 12. Balance of purchase/sale of foreign currency in Belarus domestic market by population, progressive total
Note: from April to September 2011 the illegal cash foreign exchange market prevailed, which is not accounted for in the graph.
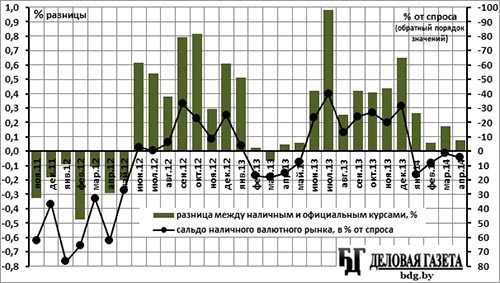
The small excess of the cash currency rates over the official is a sign of the stability in the foreign exchange market. This is what is taking place now – the difference between cash rates and official rates is quite insignificant (fig. 13).
Fig. 13. Difference between exchange rates in cash market (weight average based on purchase/sale operations) and official in actual deals (National Bank’s data) and the balance of purchase/sale in cash market as % of the demand
Interestingly, the volume of Belarus foreign exchange market in the physical persons segment is currently over the similar one in Ukraine even in total number, despite the almost five times difference in population. Thus, in Ukraine in April banks sold $427.1 million to the population in cash, while purchased $686.2 million (positive balance of $259.1 million).
Considering the volume of the market corrected against the population number in Belarus, the difference is even more significant (fig. 14).
Fig. 14. Volumes and dynamics of the cash foreign currency market in Belarus, Ukraine and Moldova, $/pers.
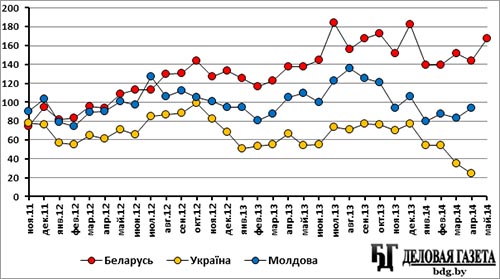
As we can see, the turnover (purchase plus sale of foreign currency) of the cash market in Belarus is the highest among the countries.
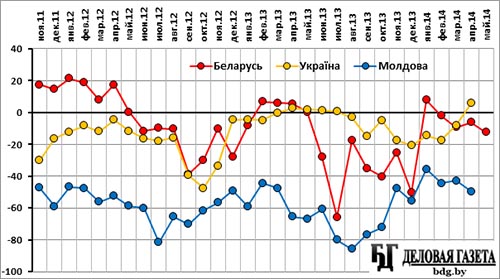
However, the balance is comparable to the one of Ukraine (a bit worse) and is much better than the one of Moldova (fig. 15).
Fig. 15 Balance of cash foreign exchange market in Belarus, Ukraine and Moldova, $/pers.
Maksim Rajeuski, BDG